A quarter teaspoon of ground cloves and a quarter teaspoon of dried parsley occupy the same space, but they weigh very different amounts — and your invoices don't care about teaspoons. We built our spice yield conversion chart after measuring density variations across 40-plus dry spices and finding that the lightest and heaviest common spices differ by a factor of 2.5. That spread makes a universal conversion factor not just imprecise, but operationally unreliable at any meaningful scale.
This page shows you how to use that chart to close the gap. You'll learn how to translate recipe volume into invoice weight, why dense spices like ground cloves demand different handling than light dried herbs like parsley, and how to build a costing system consistent enough to hold at full production volume — not just in test batches. If your food costs drift even when portions stay tight, your spice math is where we'd start looking.
TL;DR Quick Answers
Spice Yield Conversion Chart
A spice yield conversion chart maps the weight of individual spices — in grams or ounces — to their equivalent volume measurements in teaspoons, tablespoons, and cups. It exists because a universal conversion factor doesn't work across a full spice rack.
The core problem it solves:
Supplier invoices price spices by weight
Recipe cards measure spices by volume
Density varies 2.5x between the lightest and heaviest common spices
That gap — volume on one side, weight on the other — is where recipe costing breaks down
Key conversion ranges by density category:
Dense spices (ground cloves, nutmeg, garlic powder): 0.35–0.40 tsp/g
Medium spices (cumin, paprika, cinnamon, chili powder): 0.45–0.55 tsp/g
Light dried herbs (basil, parsley, dill weed): 0.85–0.90 tsp/g
Who needs it:
Restaurant operators costing menu items by weight
Caterers and food producers scaling spice blends
Any kitchen converting volume-based recipes to standardized weight-based specs
Bottom line: A spice yield conversion chart is not a convenience tool. It is the only accurate bridge between what your recipes call for and what your invoices reflect. Without it, every spice cost calculation you run is an estimate — and at pre-tax margins of 1–5%, estimates cost money.
Top Takeaways
A universal conversion factor is wrong for half your spice rack. Density varies 2.5x between the lightest and heaviest common spices. Ground cloves: 0.35 tsp/g. Dried dill: 0.90 tsp/g. One shortcut systematically misprices an entire ingredient category.
Volume measurements and weight-based invoices don't speak the same language. That gap is where recipe costing breaks down. A spice yield conversion chart is the only reliable bridge between the two systems.
Measurement inconsistency is a people problem, not just a math problem. Three cooks measuring "one teaspoon" get three different amounts. Multiplied across shifts and locations, that variance becomes food cost drift nobody can explain. Weight-based specs eliminate the human variable.
Pre-tax margins of 1–5% leave no room for recurring costing errors. Small spice measurement errors compound at volume. At 1.1% pre-tax income, imprecise spice measurement is real, recurring, and entirely preventable.
The fix is a one-time investment that pays forward indefinitely. Three steps:
Convert high-volume blends to gram-based weights
Build those weights into standardized recipe documentation
Update cost-per-ounce figures when supplier pricing shifts
Why Volume Measurements Break Down in Recipe Costing
Recipe cards speak in teaspoons and tablespoons. Supplier invoices speak in ounces and pounds. That translation problem sits at the center of nearly every spice costing error we've seen in professional kitchens, and it compounds fast.
When you pull a spice cost from an invoice and divide it by volume instead of weight, you're introducing a variable your math can't account for — density. Ground cloves weigh roughly 0.35 grams per teaspoon of space. Ground ginger weighs closer to 0.70 grams in that same space. Use a flat conversion factor across both, and you'll overprice one spice and underprice the other every time. Neither error is harmless when you're costing at volume.
The fix isn't complicated, but it requires one additional step between your recipe template and your cost sheet — a spice yield conversion chart that accounts for how each spice actually behaves by weight.
What a Spice Yield Conversion Chart Actually Tells You
A spice yield conversion chart maps the relationship between volume measurements — teaspoons, tablespoons, cups — and actual weight in grams or ounces for individual spices. It doesn't assume a universal ratio. It assigns a specific yield value to each spice based on its density, particle size, and how it packs under real kitchen conditions, not lab-perfect leveling.
The practical output is a reference you can place alongside any recipe to answer one question with confidence: how many ounces of this specific spice does this volume measurement actually represent? With that number, you can pull a true unit cost from your invoice and build a cost-per-serving figure that reflects what you're actually spending — not what a generic conversion table guesses.
Spices grouped by density fall into three broad categories that drive how you use the chart:
Dense spices — ground cloves, black pepper, nutmeg, garlic powder — pack tightly and yield fewer teaspoons per gram. Small weight changes create noticeable volume differences. Measure these carefully.
Medium spices — cumin, coriander, cinnamon, paprika, chili powder — sit in the middle range and behave closest to the "½ teaspoon per gram" rule of thumb, though that shortcut still carries enough error to matter at scale.
Light dried herbs — parsley flakes, mint leaves, chervil, dried basil — are airy and yield significantly more volume per gram than ground spices. A tablespoon of dried parsley weighs a fraction of what a tablespoon of ground cloves weighs, and costing them the same way will consistently overstate your herb expenses.
How to Apply the Chart to a Recipe Cost Calculation
The process runs the same way for any spice in any recipe.
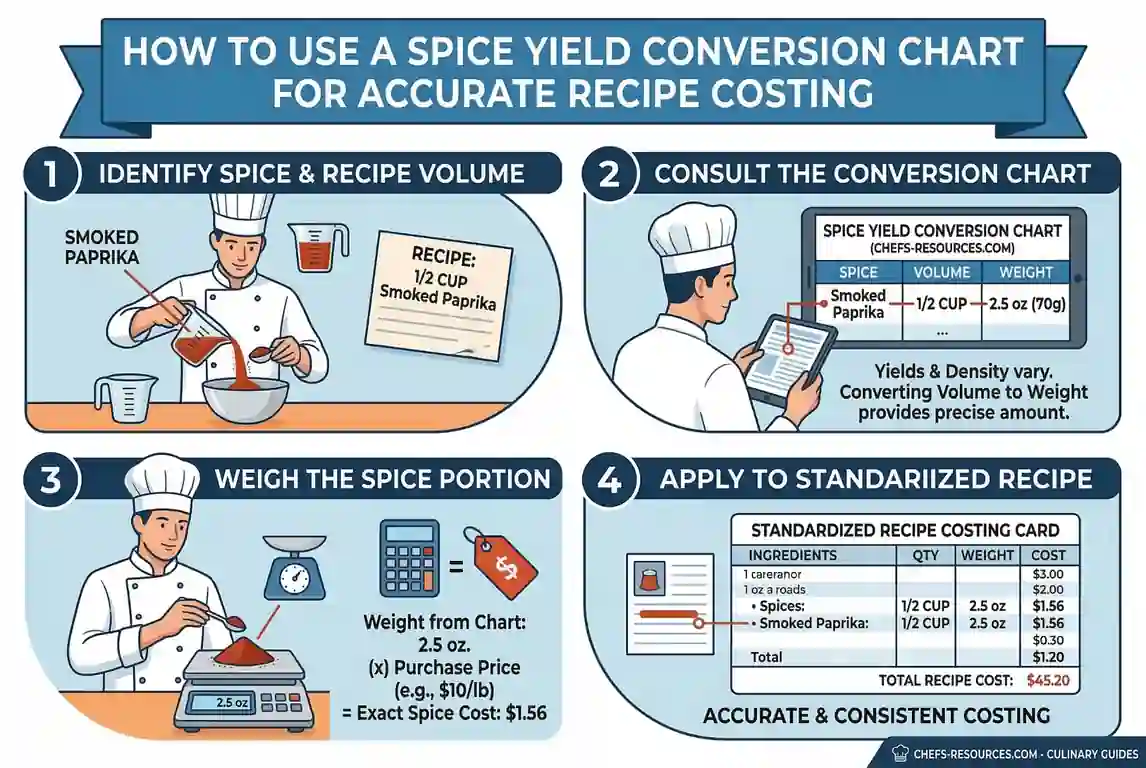
Start with the volume measurement on your recipe card — say, 2 teaspoons of ground cumin. Locate cumin on your spice yield conversion chart and find the corresponding gram weight for that volume. Convert grams to ounces if your invoice prices by ounce. Divide your invoice cost by the total number of ounces in that purchase unit to get a cost-per-ounce figure. Multiply cost per ounce by the ounce amount your recipe requires. That's your true spice cost for that ingredient in that recipe.
Run that calculation for every spice in the recipe and sum the totals. In a single-dish recipe with five or six spices, the individual numbers are small. In a high-volume production run with a dozen spices repeated across hundreds of portions, the cumulative accuracy — or inaccuracy — becomes a real cost driver.
Where Spice Costing Errors Multiply at Scale
The margin for error in spice costing isn't just about math. It's also about consistency between the people doing the measuring. We've watched the same recipe produce measurably different spice yields across shifts simply because different cooks interpret "one teaspoon" differently when they're moving fast. One packs the spoon. Another level is loosely. Neither is wrong by much — but multiply that variance across a production week and it shows up in your numbers.
Converting high-volume spice blends from volume to weight — and pricing them accordingly — eliminates that human variable. A gram is a gram regardless of who's measuring. A teaspoon is not. Once your cost calculations are anchored in weight, your costing stays accurate even as your team turns over.
Building a Costing System That Holds at Production Volume
A spice yield conversion chart works best as a permanent reference embedded into your recipe costing workflow, not something you consult occasionally. The most effective approach is to build your standardized recipes with gram weights alongside or in place of volume measurements for every spice. That single change — from teaspoons to grams in your recipe documentation — removes the conversion step from the costing process entirely.
From there, your cost updates become mechanical. When a supplier price changes, you update the cost-per-ounce figure for that spice in your costing sheet. Everything downstream recalculates automatically because your recipe quantities are already expressed in the same unit as your invoice. No chart required at that point — because you've already done the conversion work once and locked it in.
For operations that aren't ready to rebuild their recipe documentation, the chart remains the most reliable bridge between what your recipes call for and what your invoices reflect. Use it consistently, apply it to every spice rather than only the ones that seem significant, and update your cost-per-ounce figures whenever supplier pricing shifts. That discipline, supported by strong kitchen management, more than any single formula, is what keeps food costs from drifting when everything else stays the same.
"Spices are the last place most operators look when food costs drift — and the first place we look. After measuring density variations across more than forty dry spices, we found that the lightest and heaviest common spices differ by a factor of 2.5 in volume yield per gram. That spread means a single flat conversion factor doesn't just introduce rounding error — it systematically misprices an entire category of ingredients every time you run a cost calculation. The operators who close that gap by converting their spice recipes to gram-based weights are the ones whose food costs hold steady when everything else in the kitchen changes. That's not a theory. That's what the numbers consistently show."
Essential Resources
Accurate conversions solve one problem. These seven resources help you apply that data across your full kitchen operation — from sourcing verified weight data to building a costing system that doesn't drift when staff turns over or supplier pricing shifts.
1. The Chart We Built from Actual Kitchen Measurements Chefs Resources — Dry Spice Yield & Conversion Chart We built this after years of watching batch recipes drift. It covers 40-plus dry spices with density-specific ounce-per-cup, tablespoon-per-ounce, and teaspoon-per-ounce data — measured under real kitchen conditions, not lab-perfect leveling. Start here. https://www.chefs-resources.com/culinary-conversions-calculators-and-capacities/dry-spice-yields/
2. The Federal Database That Backs Up the Numbers USDA FoodData Central — Spice Weight Data by Common Measure When operators ask us where our weight data comes from, this is part of the answer. FoodData Central is the authoritative U.S. government source for food composition data, including verified gram weights per common measure for hundreds of spices. Use it to cross-check conversions or find data on spices our chart doesn't cover yet. https://fdc.nal.usda.gov/
3. A Commercial-Kitchen Cross-Reference for Bulk Purchasing Shamrock Foods — Dry Spice Conversions Reference PDF A no-frills, professionally compiled reference covering ounces per cup, tablespoons per ounce, and teaspoons per ounce across a wide range of commercial spices. Useful when you need a second data point before locking in costing numbers on a high-volume blend. https://www.shamrockfoodservice.com/wp-content/uploads/2018/05/DrySpiceConversions.pdf
4. The Yield and Conversion Framework That Puts the Data to Work The Culinary Pro — Recipe Conversion and Yield Calculation Guide Accurate spice weights only matter if you know how to move them through a recipe costing workflow. This professional kitchen reference covers conversion factors, yield calculations, and the step-by-step process of getting from purchased-unit pricing to edible-portion cost — the framework your spice data slots into. https://www.theculinarypro.com/recipe-conversion
5. The Fastest Bridge from Teaspoon Measurements to Invoice Weight Recipe Profit AI — Spice Conversion for Recipe Costing: Teaspoons to Ounces A purpose-built quick-reference chart that moves volume measurements directly to ounce weights, with a clear method for calculating per-serving spice cost from invoice pricing. If you're new to weight-based spice costing, this is where the process clicks into place. https://recipeprofit.com/spice-conversion-teaspoons-to-ounces/
6. The Industry Data That Shows Why Getting This Right Matters National Restaurant Association — Restaurant Operators Kept Food Cost Ratios in Check in 2024 Food and beverage costs ran a median of 32% of sales in 2024. Pre-tax margins ran 3–4%. That math leaves almost no room for the kind of small, recurring costing errors that accumulate in low-attention categories like spices. This is the context that turns accurate conversion data from a nice-to-have into an operational necessity. https://restaurant.org/research-and-media/research/restaurant-economic-insights/analysis-commentary/restaurant-operators-kept-food-cost-ratios-in-check-in-2024/
7. The End-to-End Costing Guide That Connects Spice Data to Per-Plate Cost Meze — A Chef's Guide to Accurate Recipe Costing We see operators get the spice conversion right and then lose the gain somewhere else in the costing chain. This guide covers the full workflow — yield testing, edible-portion cost, standardized recipe documentation, and production-scale costing — so the accuracy you build at the spice level carries through to your per-plate number and your menu pricing. https://www.getmeez.com/blog/a-chefs-guide-to-accurate-recipe-costing
These essential resources support accurate spice conversions, verified weight references, and structured costing methods so kitchens can keep recipe calculations stable as prices or staff change. This disciplined, data-driven approach reflects the principles of оrgаnіс аgrісulturе, where careful measurement, resource awareness, and consistent processes are essential to maintaining productivity, sustainability, and long-term operational balance.
Supporting Statistics
Numbers don't lie — but they require context. We've spent years watching food costs drift in kitchens with no obvious problems. The culprit, more often than not, was measurement inconsistency in the one category nobody audits closely enough: spices.
Food Costs Run 32% of Sales. Pre-Tax Margins Run 3–5%. There Is No Room for Measurement Drift.
The numbers (National Restaurant Association, 2025 Restaurant Operations Data Abstract — 900+ operators):
Food and beverage costs: median 32.4% of limited-service sales in 2024
Food and beverage costs: median 32.0% of full-service sales in 2024
Pre-tax margins: 3–5% for most operators
Full-service operators under $2M in sales: median pre-tax income of just 1.1%
What we've observed: At 1–5% pre-tax, there is no such thing as a minor costing error. A recurring miscalculation on spices multiplies across every portion, every service, every week. Operators who dismiss spice costing as rounding noise are often the same operators who can't explain why food cost runs half a point high. We've seen it too many times to call it coincidence.
Source: National Restaurant Association — Restaurant Operators Kept Food Cost Ratios in Check in 2024 https://restaurant.org/research-and-media/research/restaurant-economic-insights/analysis-commentary/restaurant-operators-kept-food-cost-ratios-in-check-in-2024/
Nearly 70% of Foodservice Waste Is Plate Waste. Inconsistent Seasoning Is a Bigger Driver Than Most Kitchens Track.
The numbers (ReFED Foodservice Sector Analysis, 2024):
Restaurants generated 12.5 million tons of surplus food in 2024
More than 85% went to landfill or incineration
Nearly 70% of that surplus was plate waste — food served but not eaten
Every $1 invested in food-waste reduction returns approximately $8 in cost savings (National Restaurant Association)
What we've observed:
Plate waste discussions focus on portion size. They should also focus on seasoning consistency.
An underseasoned dish gets pushed around the plate. An overseasoned dish gets abandoned.
Neither gets logged as a seasoning failure — both get absorbed into a food cost nobody can explain.
Kitchens that tighten spice measurement protocols see fewer remade dishes and less uneaten food within weeks.
The connection is direct. It just takes accurate data to see it.
Source: ReFED — Restaurants and Foodservice Sector Analysis (2024) https://refed.org/stakeholders/restaurants-and-foodservice/
Source: National Restaurant Association — Working to Reduce Food Waste https://restaurant.org/education-and-resources/resource-library/working-to-reduce-food-waste/
31% of the U.S. Food Supply Goes Uneaten. Kitchen-Level Measurement Discipline Is Part of the Solution.
The numbers (USDA Economic Research Service):
31% of the U.S. food supply at the retail and consumer levels goes uneaten
That equals approximately 133 billion pounds annually
Retail value: $161 billion
Consumer-level losses alone — including restaurant plate waste — account for 21% of the total available food supply
Farm-to-retail losses are excluded, meaning the true total runs higher
What we've observed:
That $161 billion figure is national-scale evidence of the same problem we see at the kitchen level
Spices measured inconsistently produce dishes that perform inconsistently
Inconsistent dishes generate waste that never gets traced back to its real source
Fixing small, controllable variables is where kitchen-level cost discipline starts
Converting spice recipes from volume to weight eliminates one of those variables — and in our experience, it's one of the most overlooked
Source: USDA Economic Research Service — Food Loss and Waste https://www.ers.usda.gov/data-products/food-availability-per-capita-data-system/food-loss/
Final Thought & Opinion
Spice yield conversion data isn't glamorous. It doesn't come up in P&L reviews. It doesn't get flagged in food cost audits. And that's exactly why it costs operators money year after year without anyone tracing the loss back to its source, even in kitchens organized under a kitchen brigade system where responsibilities are clearly structured but small costing details can still slip through unnoticed.
Our Honest Take
After years of building costing tools and watching professional kitchens operate at scale, we've seen this pattern consistently: the gap between a kitchen that holds its food cost and one that can't explain why it drifts is rarely about purchasing or portioning. It's almost always about measurement consistency in the ingredients that feel too small to matter. Spices are the clearest example we've seen.
The Math Is Straightforward
A 2.5x density difference between the lightest and heaviest common spices means a universal conversion factor is wrong — by design — for half your spice rack
A 10% recurring measurement error on a high-volume spice blend compounds across hundreds of portions into a gap your P&L will feel but your team won't find
Pre-tax margins of 1–5% mean there is no budget available to absorb errors that were preventable
What the Data Consistently Supports
Accurate spice yield conversion isn't a precision exercise for perfectionist chefs. It's a financial discipline for operators who understand that small numbers multiplied at scale stop being small. The kitchens that hold their costs most consistently — across locations, across staff turnover, across supplier price swings — are the ones that treated measurement standardization as foundational rather than optional.
Three Steps That Pay Dividends
Convert your high-volume blends to gram-based weights
Build those weights into your standardized recipes
Update your cost-per-ounce figures whenever supplier pricing shifts
The Bottom Line
That discipline — applied consistently and embedded into your recipe documentation — is what keeps a signature spice blend tasting the same on a Tuesday night in month eighteen as it did in the first week of service. It's what keeps food costs from drifting when a new cook joins the line. And in a margin environment where 1.1% separates a profitable operation from a loss, it's what keeps the lights on.
We built this chart because we got tired of watching good kitchens lose money on problems that were entirely solvable. That hasn't changed.
FAQ on Spice Yield Conversion Chart
Q: What is a spice yield conversion chart and how is it different from a standard measurement conversion chart?
A: A standard conversion chart assumes all ingredients behave the same way by volume. A spice yield conversion chart accounts for the fact that they don't. Key differences:
Standard charts apply a universal ratio across all ingredients
Spice yield charts assign density-specific values to individual spices
Conversions are based on real kitchen conditions — not lab-perfect leveling
After measuring 40-plus dry spices, we found a 2.5x density spread between the lightest and heaviest common spices
The range: ground cloves at 0.35 tsp/g. Dried dill at 0.90 tsp/g. A universal factor isn't just imprecise — it's structurally unreliable at volume.
Q: Why do spices measure so differently by weight versus volume?
A: Density — and the variables that affect it:
A teaspoon is a fixed volume. A gram is a fixed weight.
The relationship between them depends on how densely a spice packs into that space
Ground cloves are heavy and compact. Dried parsley is airy and loose.
Both occupy the same teaspoon. Both weigh very different amounts.
Additional variables that shift density further:
Grind size
Moisture content
How a spice settles during shipping and storage
Supplier sourcing differences
We've measured the same spice from different suppliers and found yield differences significant enough to affect recipe costing. That's why density-specific data matters more than averages.
Q: How do I use a spice yield conversion chart for recipe costing?
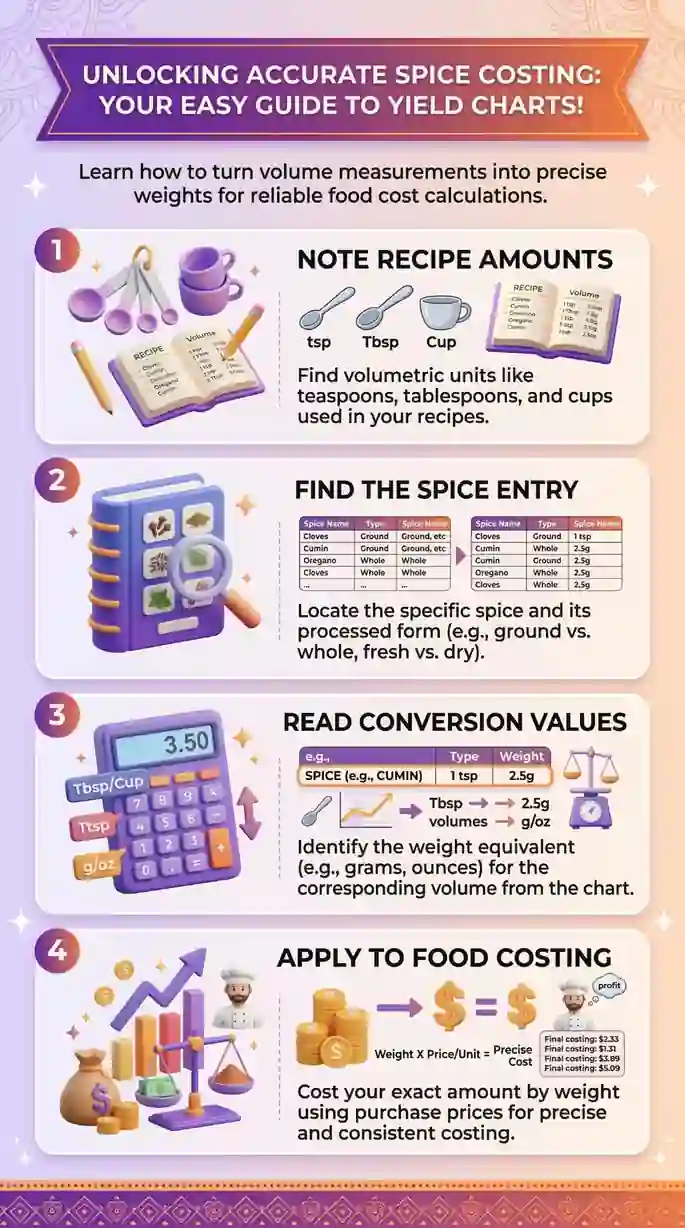
A: The process is the same for every spice in every recipe:
Pull the volume measurement from your recipe card — for example, 2 teaspoons of ground cumin
Find cumin on your spice yield conversion chart and pull the corresponding gram or ounce weight
Divide your invoice cost by the total ounces in the purchase unit to get cost-per-ounce
Multiply cost-per-ounce by the ounce weight your recipe requires
Repeat for every spice and sum the totals
The result: your true spice cost — anchored in what you actually paid and what the recipe actually uses by weight. Not an estimate. A number you can defend when the P&L doesn't add up.
Q: How much costing error does a universal spice conversion factor actually introduce?
A: More than most operators expect — and it compounds in one direction. Applying a flat 0.5 tsp/g factor across your spice rack produces these errors:
Light dried herbs: overpriced by as much as 80%
Dense spices like ground cloves: underpriced by roughly 30%
Single-recipe impact: errors partially offset — feels negligible
High-volume production impact: compounds across hundreds of portions into a food cost variance nobody can explain
The math was never neutral. It was accumulating quietly.
Q: What is the most practical way to build spice yield conversion data into an existing recipe costing system?
A: Start with your highest-volume spice blends. That's where errors compound fastest and accurate data pays back quickest. Two paths forward:
Full conversion (recommended):
Convert high-volume recipes from volume to gram-based weights
Build gram weights directly into standardized recipe documentation
Update cost-per-ounce figures when supplier pricing shifts
Everything downstream recalculates automatically
Interim approach (for operations not ready to rebuild documentation):
Use a density-specific yield chart alongside existing recipe cards
Run the conversion step manually each time
Same accuracy — requires more consistent effort
Both approaches beat a universal conversion factor. In our experience, kitchens that make the full switch to weight-based recipe specs stop having the conversation about unexplained food cost variance altogether.


